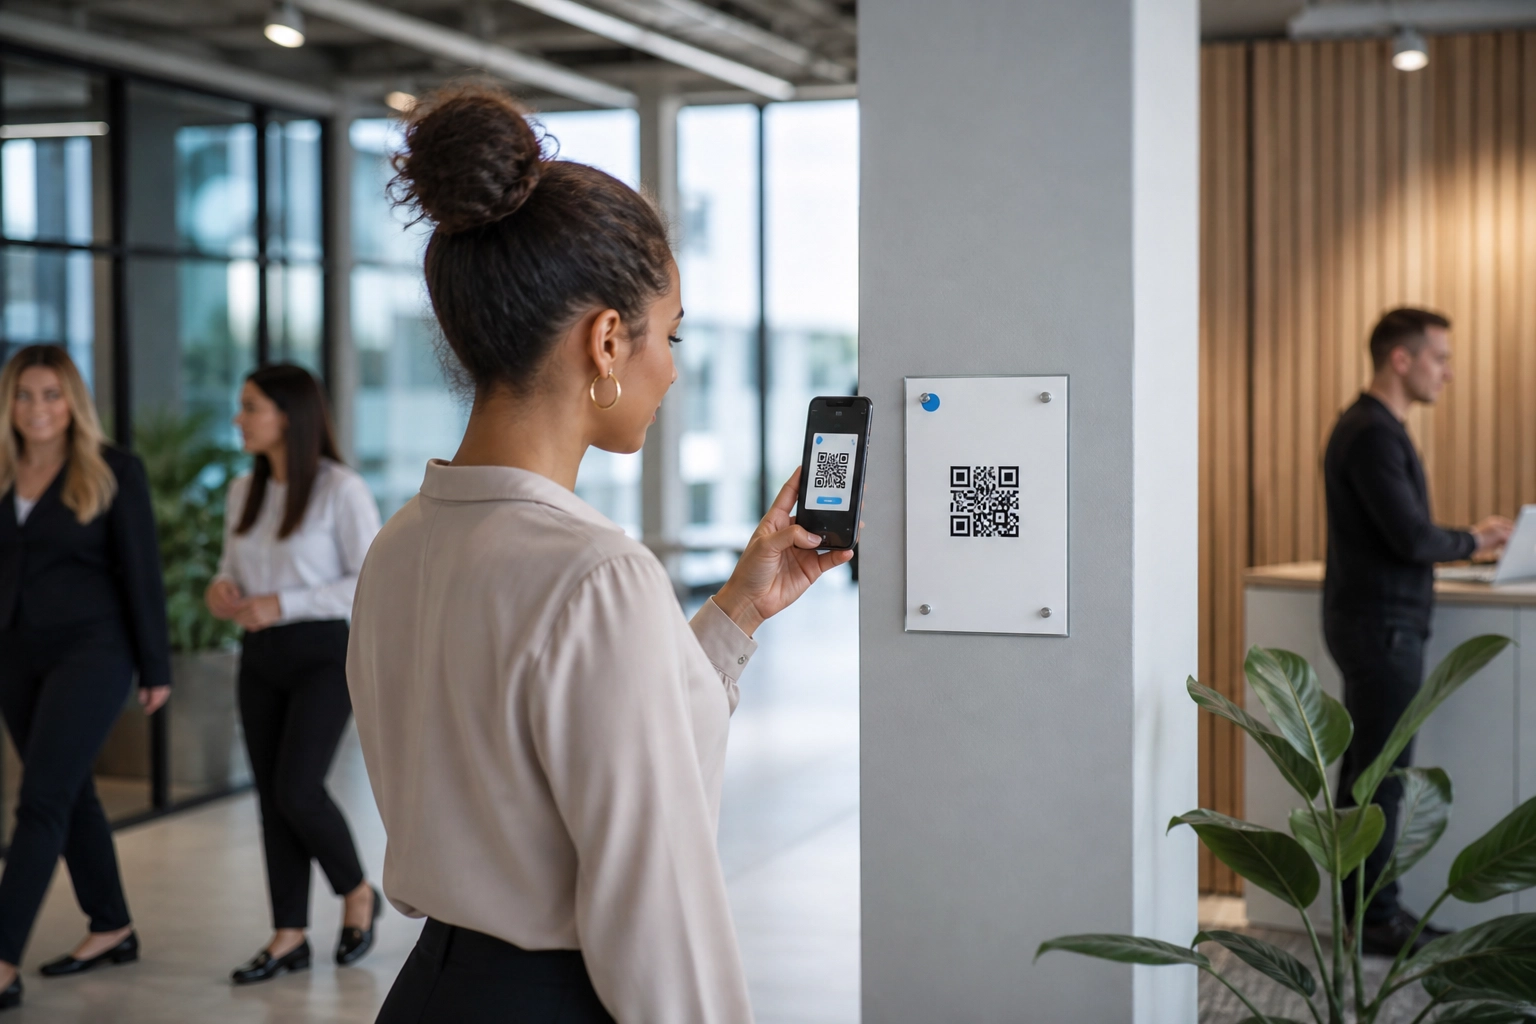
An ugly QR code at the clock-in reader will beat a beautifully branded one in a corridor nobody pauses in. That is the uncomfortable truth behind effective employee QR campaigns: scan rates are governed less by artwork than by physical context. Line of sight at the moment of need, available dwell time, whether hands are free, lighting, and signal strength all determine whether someone scans. This post treats placement as a practical discipline, not a design contest, and sets out the placement decisions that actually govern scans when your audience is staff on the move.
You will learn why a polished code in the wrong corridor fails, what the current evidence on QR scanning does and does not support, and how to audit candidate surfaces by moment of need and dwell time. Then we will tier surfaces into three bands, review what works and fails on each, make placement measurable with one code per surface, and only then design the code. Start with the audit. The design comes second.
Why a Beautifully Branded Code in the Wrong Corridor Fails
Placement beats artwork, because a code on a wall nobody pauses at loses to a plain one at the clock-in reader.
Five physical variables decide whether a scan happens: line of sight at the moment of need, dwell time, whether hands are free (a tray, patient notes, a forklift), lighting, and mobile signal. These are widely accepted in practice but thin in published workplace research, so use them as a checklist to test rather than a set of settled findings.
Placement comes first, design second. A QR code sitting where nobody stops goes unread, however polished the code or its call to action. Think of the plain black-and-white code as a useful benchmark surface against which any branded version should be compared.
Consider an illustrative scenario: two identical codes, one laminated to a staff room noticeboard and one fixed beside the clock-in reader. The clock-in code wins because the scan asks for almost no extra effort.
This is a placement playbook for internal comms, HR and operations teams, not a design critique. Read it as a repeatable audit you can run this quarter. If your audience includes frontline or deskless colleagues, the deskless staff playbook covers where to place codes and how to measure action. And because placement claims need testing on your own surfaces, review how click-through reporting works before you set your benchmarks.
What the Evidence on QR Scanning Actually Supports
The case for placement rests on friction, not decoration. The U.S. Census Bureau’s usability study argues that entering an alphanumeric web address on a phone keyboard increases error and burden, and burden can depress response. That is the argument for a code wherever typing a URL is awkward.
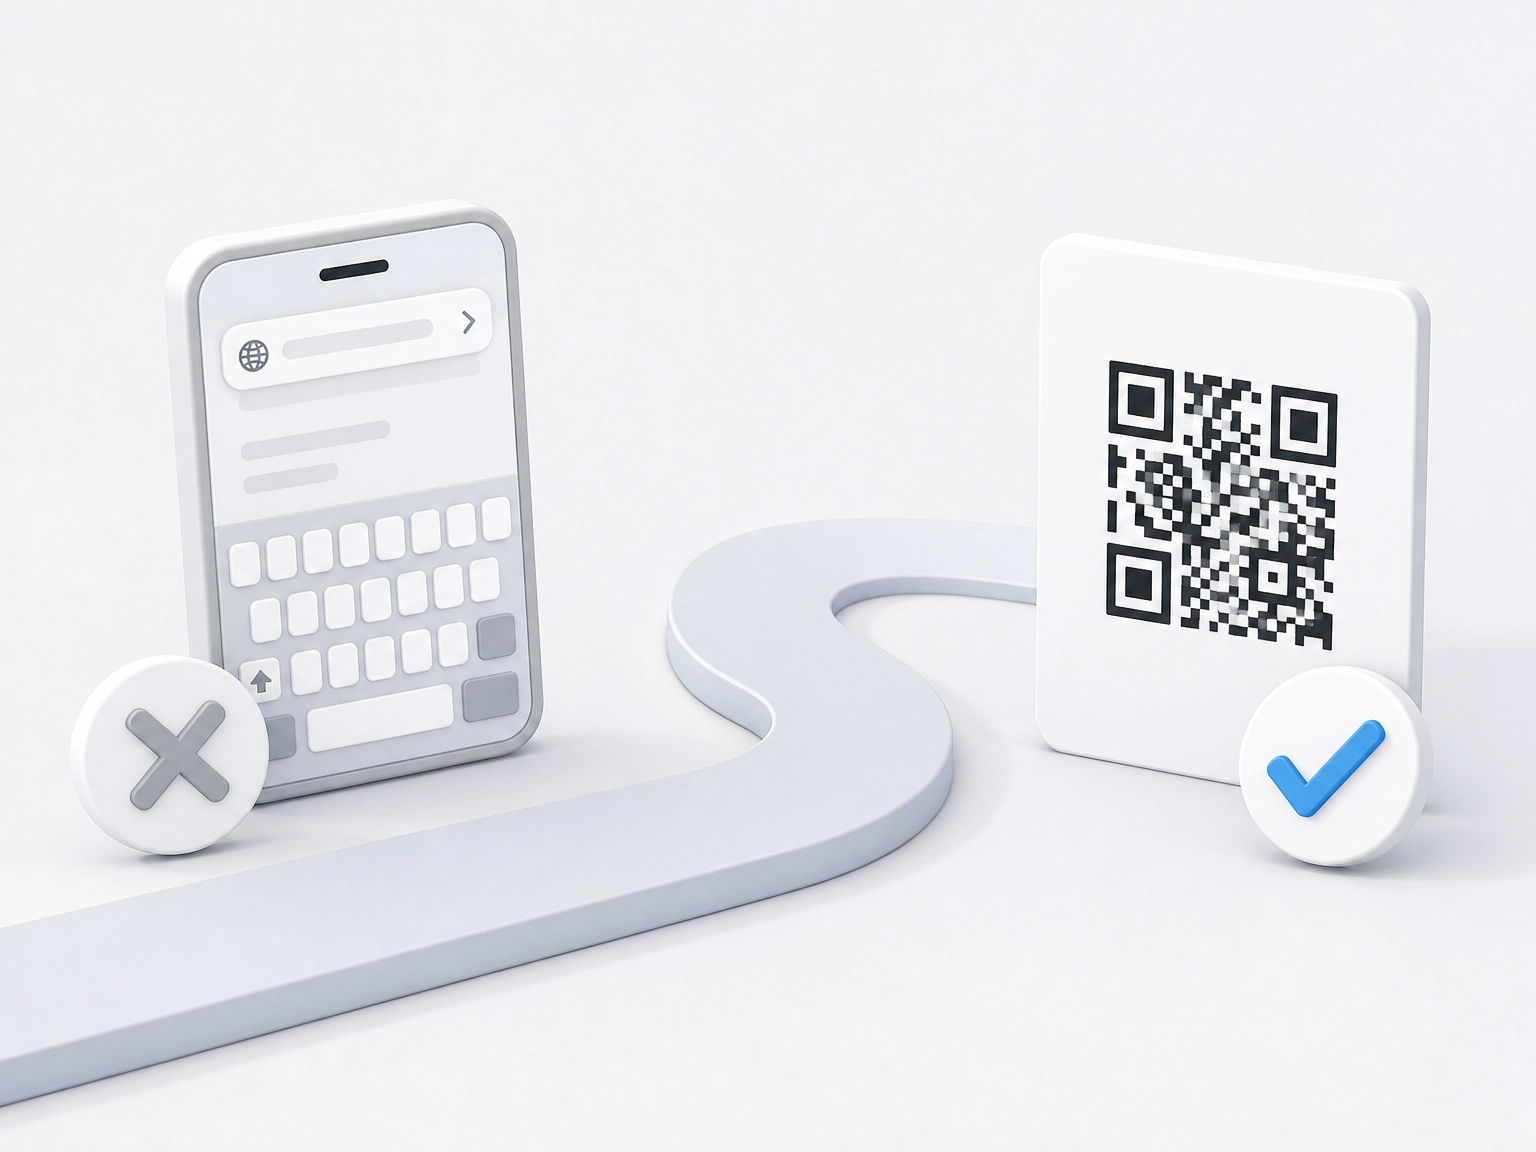
The same study found all 20 respondents scanned successfully, averaging 12.4 seconds, and rated it “extremely easy”. Note the sample: n=20, with no participant lacking prior QR experience. That measures ease of use, not reach or willingness.
Field evidence is modest and comes from a different context. A randomised statewide mail experiment found QR inclusion raised participation by 1.31 percentage points and web completion by 1.01 points, with 6, 7 and 11 point gains across three hard-to-reach subgroups. The findings are survey-response data, not workplace data. Do not read them as employee scan rates.
Destination matters as much as the code. NN/g guidance is that codes need clear, brief, contextual information and must lead to a relevant page; a scan landing on a generic intranet homepage wastes the placement you fought for. For deskless audiences, our guide to QR campaigns that reach frontline staff covers the mechanics.
There is effectively no published workplace data on clock-in readers, staff rooms or lanyards. Treat the playbook that follows as a recommended, testable framework, and read any spatiotemporal scanning research in full before drawing a claim from it.
Step 1: Audit Surfaces by Moment of Need and Dwell Time
Placement is testable, so test it before you write anything. Begin with the moment of need, not the wall. List every employee task where a phone is already in hand or a URL is genuinely awkward to type: checking a shift pattern, booking holiday, completing a compliance form, finding a payslip, logging a safety observation. These tasks define where a code can earn a scan.
Score dwell time, then hands
Rank candidate spots by the realistic seconds a person stands there. A toilet cubicle, kettle queue or canteen table gives 30 seconds or more. A main corridor at shift change gives two or three. Next, run a hands test. Note locations where people carry a tray, patient notes, tools or a tablet, or operate a forklift. Occupied hands make a surface a poor candidate unless the code sits at eye level on a route the employee already stops on. These numbers are working estimates, and your own site walk is what confirms them.
Log constraints on site
Walk the audit in person and record three constraints per surface: lighting (low-light stairwells, glare on exterior glass), mobile signal, and reachability. Can you scan from where you naturally stand, or does it demand an odd angle?
Build the ranking table
Capture surface, expected moment of need, estimated dwell time, hands-free yes or no, and a confidence rating. This table is your ranking input for the next step. If the destination sits inside a platform you are also reviewing, what separates internal comms platforms covers the evaluation questions that matter.
Step 2: Tier the Candidate Surfaces into Three Bands
With that table ranked, group the surfaces into three bands. The bands are a working framework to test, and the scan data you gather later is what promotes or demotes a surface.
Tier 1: high intent, forced attention. Clock-in and clock-out readers, turnstiles, locker banks, vehicle checks and payslip delivery points.
Tier 2: dwell time and repeat traffic. Staff rooms, canteen tables, kettle points, locker room mirrors, and deskside or end-of-shift handover boards. Intent is lower than Tier 1, but you gain seconds on the clock and repeat exposure every shift.
Tier 3: mobile and personal surfaces. Payslips and pay envelopes, lanyard cards and badge backs, ID holders, tool cases, workwear pockets and printed shift briefings. These reach people who never pass a noticeboard, but everything depends on the employee carrying the item and looking at it.
Equipment and safety surfaces. Equipment is not a tier; it is treated separately because signal, wear and safety rules usually decide it. Machine start-up panels, delivery vans, forklifts, clinical trolleys and site containers offer high relevance, yet those constraints often settle whether a code is realistic. HSE guidance warns that too many signs create confusion, so keep these surfaces sparse.
Finally, be honest about scale. Start with two or three Tier 1 and Tier 2 surfaces, and expand only when scans per surface show which band is working. Treat that scan data as your evidence base, much as you would measure internal email performance.
What Works and What Fails on Each Surface
Clock-in points. Keep the code at eye level or just below, within the natural path of the hand reaching for the reader, and pair it with one line of context. Never position it where a queue blocks the view, or where employees already scan a different code for attendance.
Staff rooms and canteen tables. Table talkers, fridge-door and kettle-side codes beat wall posters because they sit where someone is already settled with both hands free. Avoid clustering several codes on one noticeboard; at 7am, that choice will not be made.
Payslips, lanyards and similar personal items. Match the destination to the item: a benefits summary, a payslip explainer or a short feedback form. If you are deciding what sits behind it, this internal platform versus email software comparison covers the measurement question.
Equipment and site surfaces. Check mobile signal first. Then factor in wear, grease, cleaning regimes, and whether a label damages the surface or breaches a safety requirement. A durable label or QR insert beats a printed sticker.
Cross-cutting failure modes. Codes behind glass that reflects a light source. Codes below knee height. Codes with no context line. Codes competing with three others on the same surface. Every one is a placement error, not a design error.
With each surface assessed against these patterns, the next step is making placement measurable.
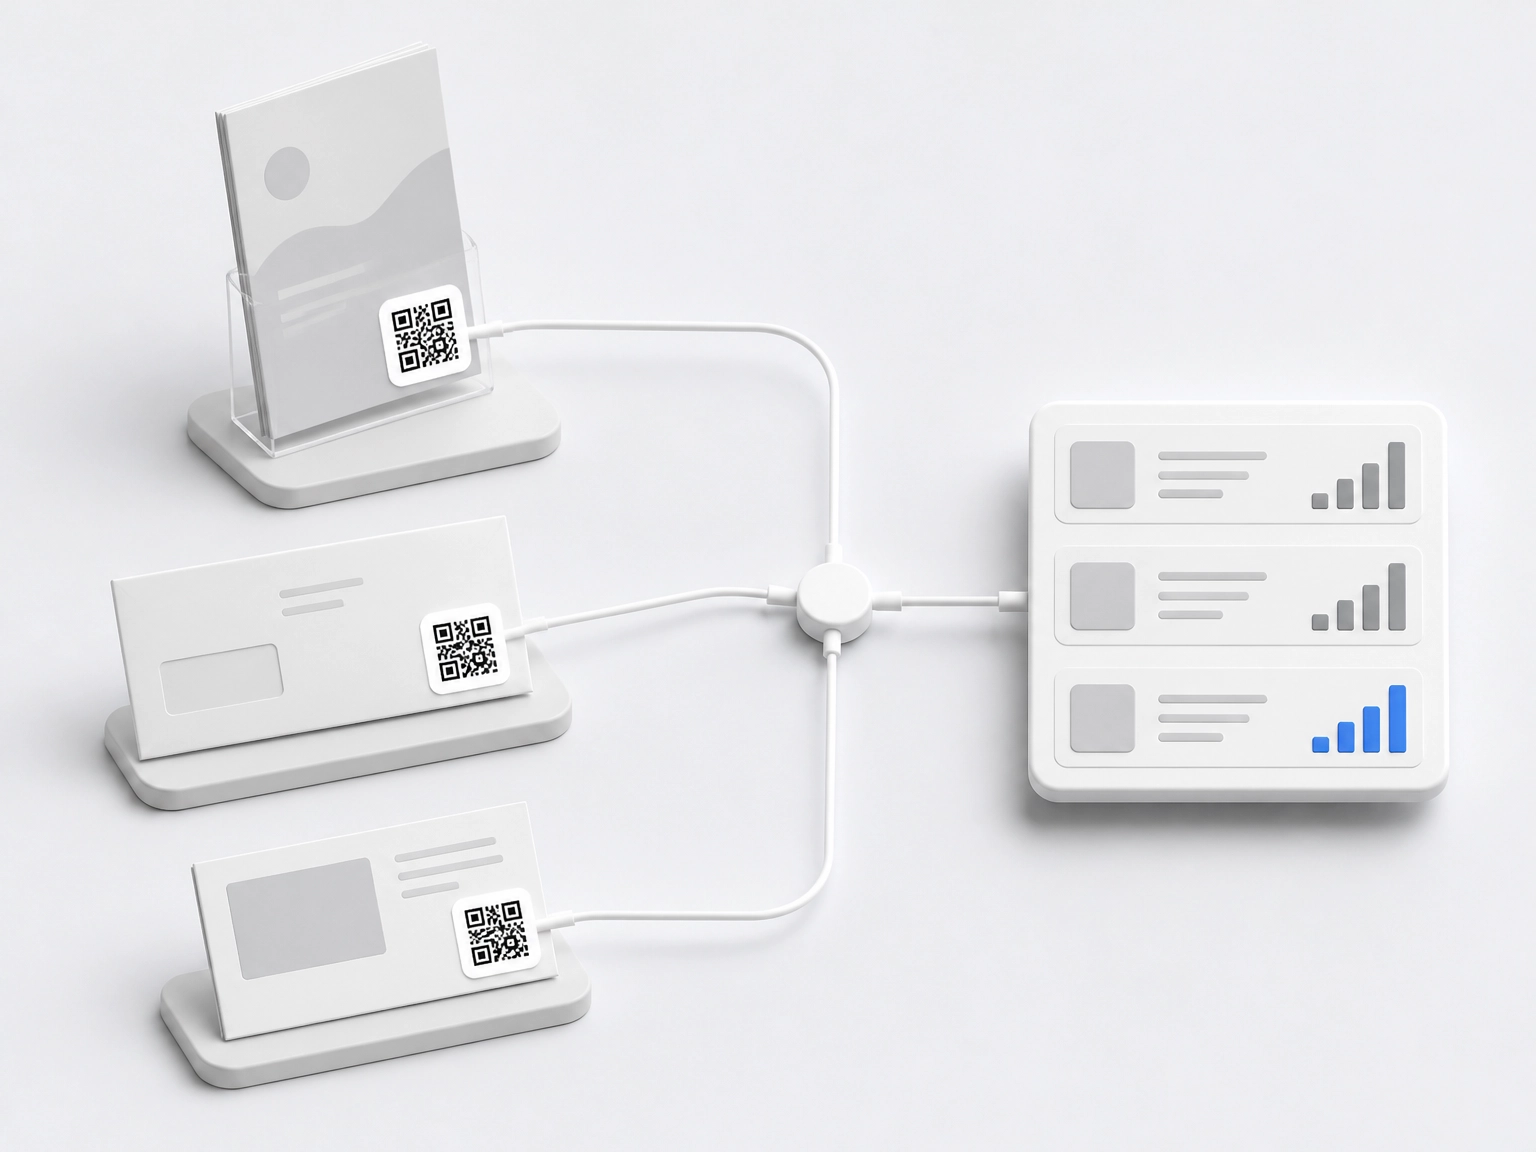
Step 3: Make Placement Measurable with One Code per Surface
Once you know which surfaces fail, make each placement answerable for its own numbers. Give every surface a unique code or tracked URL, so scan volume can be attributed to the placement rather than the campaign as a whole. The randomised mail experiment cited earlier used a unique code per address; apply the same logic to a clock-in reader, a kettle-side table talker and a lanyard card.
Before launch, agree four metrics: scans per surface, scan rate against estimated footfall or headcount, landing-page completion rate, and time from launch to meaningful volume. Agreeing these in advance matters more than matching them to an industry standard, because there is no comparable benchmark to borrow.
Run the test lightly. Rotate the same message across two comparable surfaces for a fortnight, keep the winner, remove the loser. Placement is easier to change than artwork, copy or destination, so it is the cheapest variable to trial.
Watch post-scan drop-off. A strong scan count with weak completion points to the landing page, not the surface. Check the destination page before reprinting anything.
If your internal comms platform already runs QR campaigns, its analytics should let you report scans and click-throughs alongside email performance, so placement results sit with your other channels in one view. The same discipline applies when you act on engagement survey results: attribute the response to the channel that earned it.
Step 4: Only Then Design the Code
Once placement and measurement are settled, design serves the surface, not the other way around. Test each code at the distance people will actually stand and in the real lighting at that spot, rather than judging it on a studio screen, and leave a clear quiet zone around the code. A short quiet zone is a common cause of a scanner misreading the boundary or failing silently.
Keep the context line short and benefit-led. To illustrate, “Book your holiday in 30 seconds” does more work than “Scan me” or “QR code”, because employees need to know what they get before they reach for a phone.
Match the call to action to dwell time. At a clock-in reader, offer something finishable in a minute, such as viewing a shift swap or confirming a policy. A canteen table can invite a longer survey or poll.
Across a wider campaign, a mobile marketing QR code and a print or poster code should use consistent wording and land on the same destination, so the audience built around your QR code marketing campaign recognises the journey. If a scan leads to an email sign-up or follow-up, see how to create an email newsletter.
Finally, resist branding the code into unrecognisability. Camouflaged or heavily overlaid codes fail on the surface that mattered, and no amount of polish recovers a placement nobody walks past.
Conclusion: Audit First, Design Second
Placement remains the primary lever. Before anyone opens a design tool, audit your surfaces by moment of need and dwell time, test hands-free and lighting constraints on site, and tier the results. Start narrow, and change the placement before you change the artwork.
Be honest about the evidence. The strongest QR data available comes from survey and usability studies, not workplaces. Treat your own scan data as the proof that matters for your organisation. If a code at the clock-in reader outperforms one on the canteen noticeboard, that is your finding, and it beats any general benchmark.
Revisit the audit whenever shift patterns, sites or processes change. A surface that worked last year may now sit behind a locked door, on a route nobody walks, or beside a reader that has moved.
The takeaway in one line: a plain code at the clock-in reader will beat a beautifully branded one in a corridor nobody pauses in. Choose the surface, then earn the scan.
Frequently Asked Questions
Why does placement matter more than the design of a QR code?
Scan rates are governed mainly by physical context rather than artwork. A plain code at a spot people already stop at, such as a clock-in reader, will beat a beautifully branded code in a corridor nobody pauses in. Placement comes first and design second.
What physical variables decide whether someone scans a QR code?
The post identifies five variables: line of sight at the moment of need, dwell time, whether hands are free, lighting, and mobile signal. The post notes these are widely accepted in practice but thin in published workplace research, so they should be tested as a checklist rather than treated as settled findings.
What does the evidence on QR scanning actually support?
The U.S. Census Bureau usability study found all 20 respondents scanned successfully, averaging 12.4 seconds, and rated it "extremely easy". That measures ease of use, not reach or willingness. A randomised statewide mail experiment found QR inclusion raised participation by 1.31 percentage points and web completion by 1.01 points, but these are survey-response data, not employee scan rates. The post also notes there is effectively no published workplace data on clock-in readers, staff rooms or lanyards.
How should I audit candidate surfaces for a QR code?
Start with the moment of need by listing employee tasks where a phone is already in hand or a URL is awkward to type. Then score each candidate surface by realistic dwell time and whether hands are free. Walk the site to log lighting, mobile signal and reachability, and record surface, moment of need, dwell time, hands-free status and a confidence rating in a ranking table.
How are candidate surfaces grouped, and how should I start?
The post groups surfaces into three bands: Tier 1 for high intent, forced attention (such as clock-in readers and payslip delivery points); Tier 2 for dwell time and repeat traffic (such as staff rooms and canteen tables); and Tier 3 for mobile and personal surfaces (such as lanyards and payslips). Equipment and safety surfaces are treated separately. Start with two or three Tier 1 and Tier 2 surfaces and expand only when scan data shows which band is working.